Multifocal ERG is a visual electrophysiology test of the macula that can assess macular dysfunction and monitor the progression of conditions such as age-related macular degeneration (AMD), toxicity, and others. This test can help discriminate between various retinal diseases and can also be used to rule out organic vision loss.
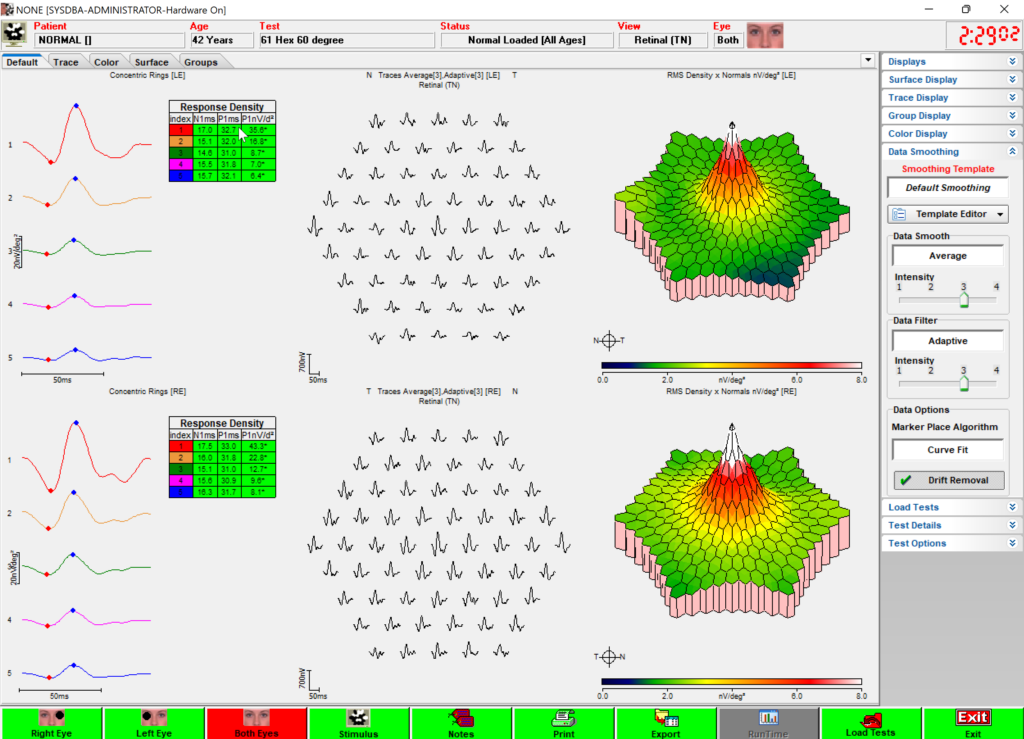
Taking the mfERG test
The mfERG test may be performed on anyone who can reliably fixate their eyes on a target.
During this test, the patient sits with their chin on a chinrest in front of a specialized monitor. Their face and neck should be relaxed as they focus on a fixation target in the center of the monitor. When the test begins, the multifocal stimulus starts to alternate at high frequency while retinal responses are recorded binocularly. The procedure consists of short recording periods interspersed with pauses for blinking. This test takes approximately four minutes and utilizes noninvasive corneal electrodes to provide superior signal quality.
Multifocal ERG stimulus
The multifocal ERG stimulus is comprised of several scaled hexagons. Each hexagon changes pseudo randomly from black to white at a rapid speed. A separate signal is recorded in response to each hexagon. To select the best stimulus size for your patient, consider the tradeoffs between spatial resolution, signal to noise ratio, and examination time.

61 Hexagon Multifocal
This is the most common multifocal test for the central 50 degrees of the visual field. It is complete with normative data for interpretation.

103 Hexagon Multifocal
This mfERG uses 103 hexagons across 50 degrees of the visual field in order to detect the smallest defects.

19 Hexagon Multifocal
This test can be used with smaller stimulators, like Envoy, for an assessment of macular function.
Interpret the results of the mfERG test
Multifocal ERG results are displayed in a few different graphs, each showing a different representation of retinal function.
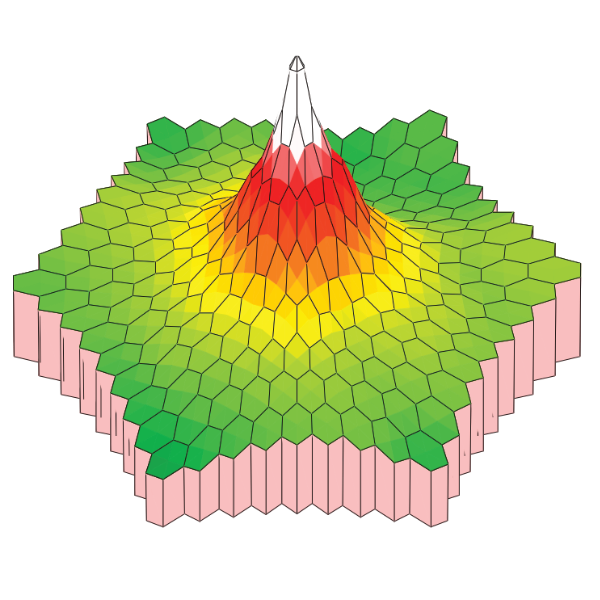
Response Density
A 3D topographical representation that illustrates the overall signal strength from each area of the retina.
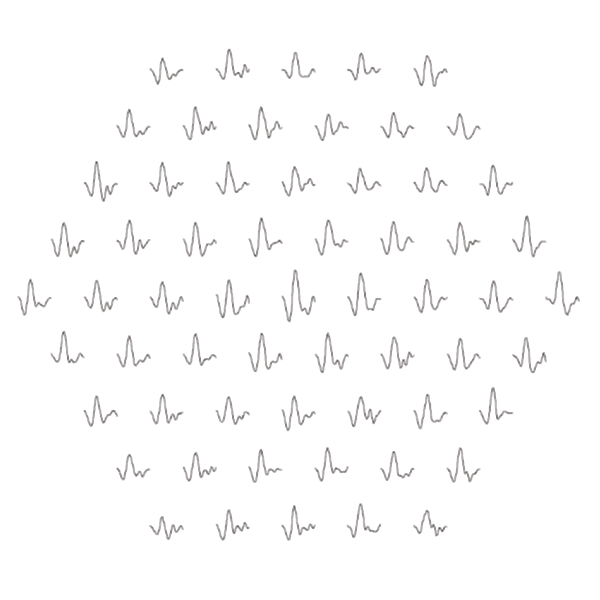
Traces
Traces showing the response that correlates with each hexagonal stimulus element.
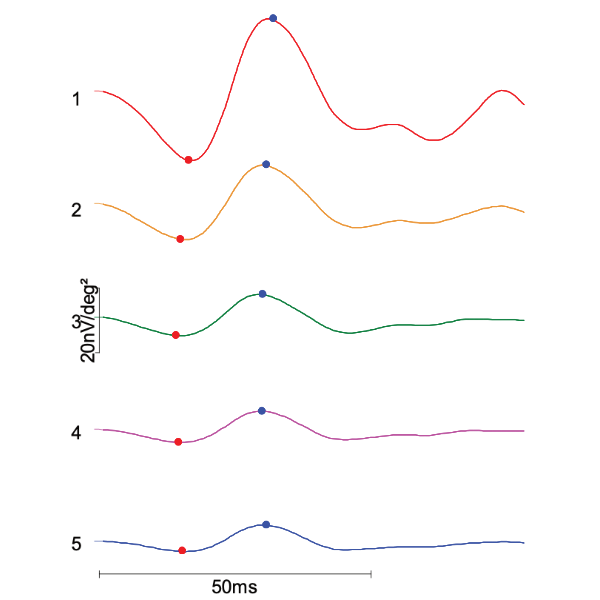
Ring Averages
Averages of the mfERG traces from concentric parafoveal regions, with clearly demarcated normative values.
References
Hoffmann, M.B., Bach, M., Kondo, M. et al. ISCEV standard for clinical multifocal electroretinography (mfERG) (2021 update). Doc Ophthalmol 142, 5–16 (2021). https://doi.org/10.1007/s10633-020-09812-w
