This tool significantly reduces the time needed to export data for those who conduct a large volume of tests.
How it works
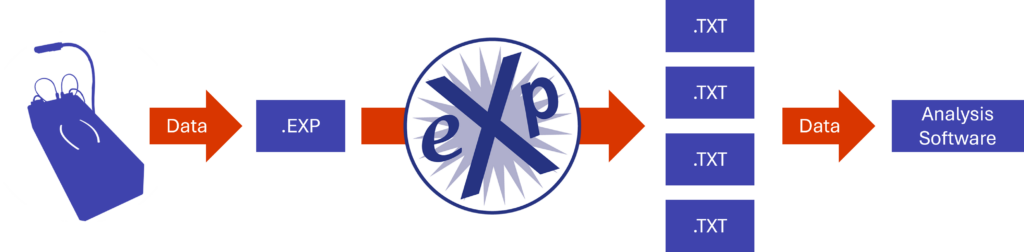
With just one click, the eXporter software creates one multi-test transfer file and automatically generates separate text files for each test, as shown in the diagram below.
Video demonstration
Trial vs. full version
| Features | Trial Version | Full version |
|---|---|---|
| Open transfer files | 1 | Unlimited |
| Export number of tests | 1 | Unlimited |
| Save destination | Default | Your choice |